


Cluster:
Building Digital Literacy
Citation:
Hocutt D.L., Ranade N. (2023, January 28). Who is our audience? Understanding critical data literacy with AI in Technical Communication (TC). Digital Life Institute. https://www.digitallife.org/who-is-our-audience-understanding-critical-data-literacy-with-ai-in-technical-communication-tc/
![]() Copy to Clipboard
Copy to Clipboard
Methods of big data analysis, supported by various tools available today, have helped enterprises better understand their users and the markets. To that end, we have been studying the way analytical systems collect, collate, and report business data, enabling businesses to look at users’ characteristics more closely. In other words, we found that we can understand more about our users through the digital footprints they leave when they consume web content. But understanding users’ needs and finding methods to do so has been a task that technical communicators have been undertaking since the inception of their role. The digital footprints, translated to data, are helping them look at users more closely and make them aware of new ways of consuming data. The Fabric of Digital Life (Fabric), a repository of digital artifacts, provides users with more than one means to access the artifacts. The collections, objects, tags go beyond what a conventional search keyword can allow. Therefore, capturing users’ information-seeking behaviors can tell us a lot about information architecture and content strategy that other websites are not able to. We use Fabric not only to learn how users consume information, but also to make sense of their behavioral patterns that can be fed into machine learning (ML) algorithms that can help us answer the question: “Who is our audience?”.
Using Fabric’s Site Analytics for Analysis
With the help of Fabric’s editorial team, we were given access to Google Analytics browsing data from the Fabric of Digital Life website. We extended that access to a group of collaborators who participated in our Council for Programs in Technical and Scientific Communication (CPTSC) funded workshop series on using data analytics in classes that ran earlier this year. Through this workshop, we explored how a web analytics platform like Google Analytics collects, configures, processes, and reports user data. We discovered ways to identify and understand user behaviors using the tool’s reports, then developed ways to validate those findings with other data sources in order to make recommendations to improve user experience and more directly meet users’ needs. As we hoped, the result of our workshop was discovering the activity and results of data analytics to help us better know Fabric’s audience preferences. For example, we discovered that Fabric attracts little traffic on mobile devices, likely because the collection’s complexity is better experienced on a desktop browser. We also discovered the impact that information architecture changes have on users’ browsing behaviors and on technical communicators’ reporting routines.
Exploring the Relationship of AI and Data Analytics
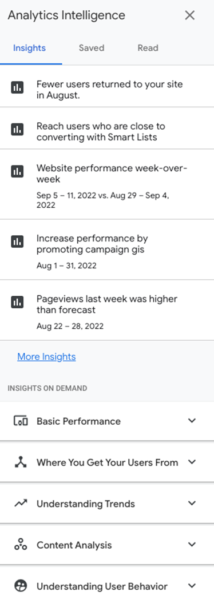
One extension of data analytics occurs when machine learning and artificial intelligence are applied to data collections like browsing activity. With partner researchers from the Digital Life Institute’s Building Digital Literacy research cluster, we recently led a workshop on the way machine learning and artificial intelligence are being implemented in Google Analytics reports. Using data collected, configured, processed, and prepared from Fabric browsing activity, Google Analytics now offers AI-generated “Analytics Intelligence” and “Insights on Demand” (see Figure 1) that highlight reporting results that appear anomalous. For example, if traffic to the site has seen a significant drop week over week, ML working in the background recognizes the change in user behavior and triggers an insight announcing the change and providing what appears to be a custom report, culled from existing data points, that reveals the change. While ample reasons remain to view such reports with skepticism, the existence of ML processes that can notify technical communicators of changes in user behavior offer opportunities to validate the audience behavior and consider what content or design changes might be implemented to address, respond to, and seek reasons for the change.
Analytics for Audience Analysis
Combining data analytics methods, testing them with the patterns obtained through ML, and improving their predictive behavior will help us provide a holistic, critical approach to audience analysis. Participating in more technical processes of audience analysis may help prevent algorithmic biases. Additionally, we can learn more about the users as well. Improved methods of data analytics can help us locate users who may get lost in other user testing such as lurkers, users who don’t participate in focus groups or those that don’t complete surveys, and also those populations that may be marginalized due to limited opportunities of content access.
Access to data analytics has changed not only some job titles, but it has created a set of new jobs that did not exist because they could not be supported. For example, the primary task of technical writers in software product documentation companies, traditionally, was to create instructions and reference materials for users who wished to use the technological products. In a few instances, people were hired with formal training in technical writing, but during the 1970s, employers typically emphasized technical knowledge over writing skill. Due to the increasing levels of differences in users behaviors, technical communicators roles have evolved from writing, to becoming user advocates through roles such as content moderators, and product managers. Further, as they seek to improve technological processes that interact directly with users, we are seeing (and hoping to see more of) the following roles:
- Technical communicators: Data analytics insights help technical communicators learn about their audience and constantly change the ways in which content is published based on the information seeking behavior that they see through those insights.
- Language and localization experts: Analytics data provides access to location information which enables decision makers at organizations to improve location-based access through localization and other ways of information consumption.
- UX specialists: Findings aid psychological research on users that feeds into disciplines like user experience design making data analytics a necessary component of user interface feedback systems.
The changing roles have provided some challenges and somewhat increased the learning curve. These challenges go beyond common issues like lack of access to more powerful data analytics tools.
Although data analytics tools like Google Analytics are shrouded in black-boxed processes, there are ways to learn about, research, and explore how these processes are shaped by machine learning and artificial intelligence. Google provides a learning center about Google Analytics, which includes brief descriptions of its platform processes (collection, configuration, processing and reporting). While the learning center is designed for Google Analytics developers, it provides useful peeks into ways that Google generally, and its programmed processes like algorithms and machine learning more specifically, articulate their approach to data collection and reporting. Correlating these approaches with other data collections and tools, like feedback on user documentation and user browsing benchmarks, can further open the black box. We believe our approach to data analytics, centered in the humanities, offers tools and approaches to cracking open proprietary programs and platforms.
We position data analytics as a critical data literacy. Our question to you is this: Given the proliferation of “big data,” the machine learning programs that process that data, and the use of artificial intelligence to communicate insights, how do we educate humanities teachers and liberal arts majors to perform and teach data analytics as critical data literacy? And to what extent do you consider this important?